Data
Contents
Data
Million Playlist Dataset
The main dataset in this project is the million playlist dataset, which includes a million user-generated playlists with ~66.3 million total tracks, ~2.2 million unique tracks and ~295 thousands unique artists on Spotify. The playlists were created during the period of January 2010 through October 2017. The dataset contains the names of the tracks, artists, and albums within each playlist, along with the duration of each track.
Spotify API
We were able to query the spotify API to get metadata for a handful of songs. The way in which we interfaced with the API was through the package spotipy. The specific query script we used is reproduced below:
import spotipy
from spotipy.oauth2 import SpotifyClientCredentials

# Initialize API
client_credentials_manager = SpotifyClientCredentials(client_id='#####',
                                                      client_secret='#####')
sp = spotipy.Spotify(client_credentials_manager=client_credentials_manager)

# Generate list of songs to query metadata for
track_uri_toquery = pd.read_csv("track_api_query.csv")
list_to_query = list(track_uri_toquery['Track_uri'])
unique_tracks = list(set(list_to_query))

# Query metadata 50 songs at a time
start = 0
end = len(list_to_query)
for i in range(start, end, 50):
    temp_list = list_to_query[i:i+50]
    playlists = sp.audio_features(temp_list)

    if "itemlist" in locals():
        itemlist = itemlist + playlists # append new data
    else:
        itemlist = playlists

    if len(itemlist) == 600: # save partial data into 600 chunks in case of error
        temp_filename = "audio_features" + str(i) + ".txt"

        with open(temp_filename,"wb") as fp: # write updated new data
            pickle.dump(itemlist, fp)
            del itemlist
    time.sleep(np.random.randint(2,5))
The metadata we obtained spanned the following track features:
- acousticness
- danceability
- energy
- instrumentalness
- key
- liveness
- loudness
- mode
- speechiness
- tempo
- valence
Most of these features have unique definitions that can be found on Spotify’s website here.
Data Processing & EDA
Due to the immense volume of the dataset and our limited time, we scaled down the million playlists dataset to two subsets of data. The first was a dataset of approximately 27,000 playlists for which we were able to obtain complete track metadata. The second was a very small dataset of 100 playlists on which we implemented our models to make sure they were working as expected. The larger of the two was labeled “track_meta” while the smaller of the two will be referred to as “subset100.”
The track_meta dataset is very useful for visualizing some of the distributions of metadata. In particular, we picked out a handful of the aforementioned features to plot in the figure below:
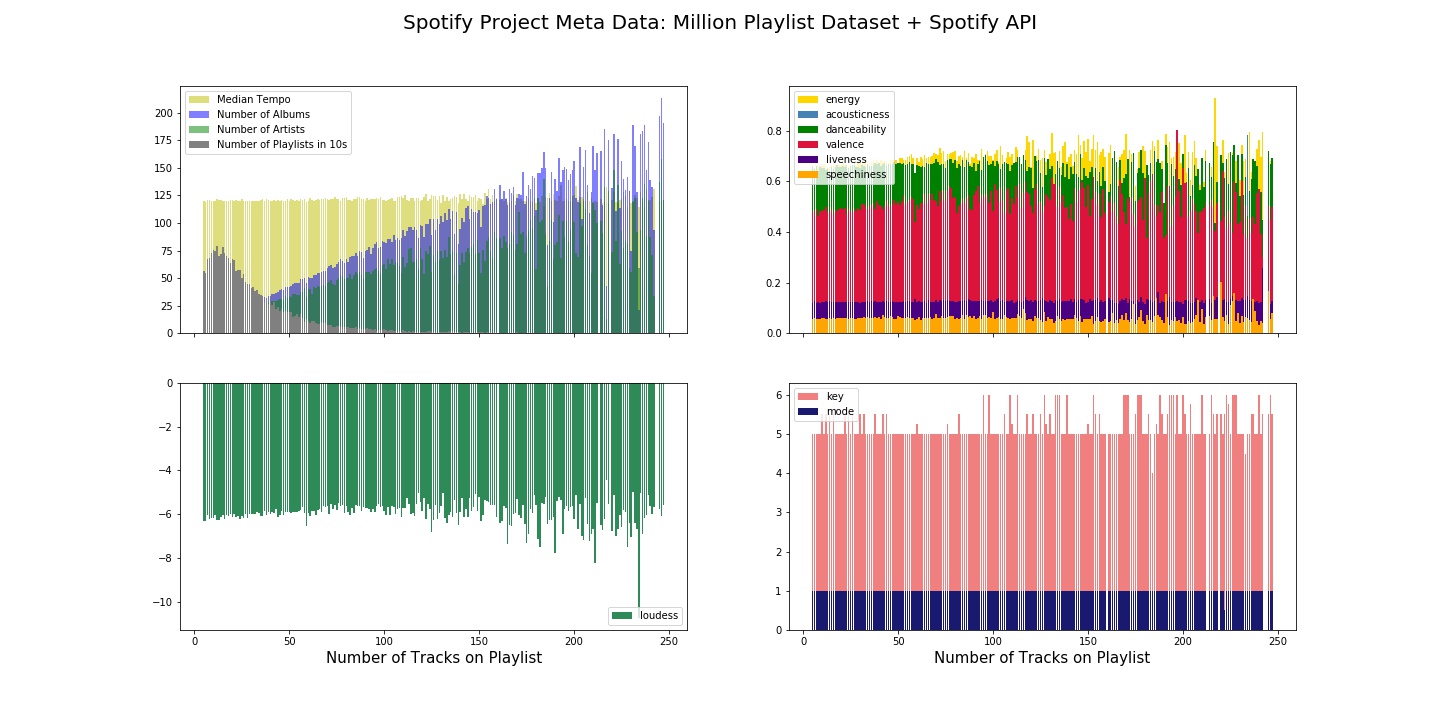
In the upper left plot one can see that the number of albums and artists increase linearly with the number of tracks as expected, and exhibit one-sided poisson like behavior when the expected value increases. The distribution of playlist lengths seems to peak around 20 songs or so, and the median tempo of songs in the playlist are all generally upbeat at around 120 bpm. Also interestingly, on the lower left plot, we can see that the median key and mode of a playlist are most often 5 and 1 respectively, which indicates that F-major is the most popular key signature for spotify listeners in our sample. Coupled with large scores for energy and danceability from the upper right plot, it seems that listeners are into feel-good, happy music on average, which intuitively makes sense.
The subset100 dataset was a great way to take a closer look at the distributions of the size of playlists, number of albums, and number of artists.
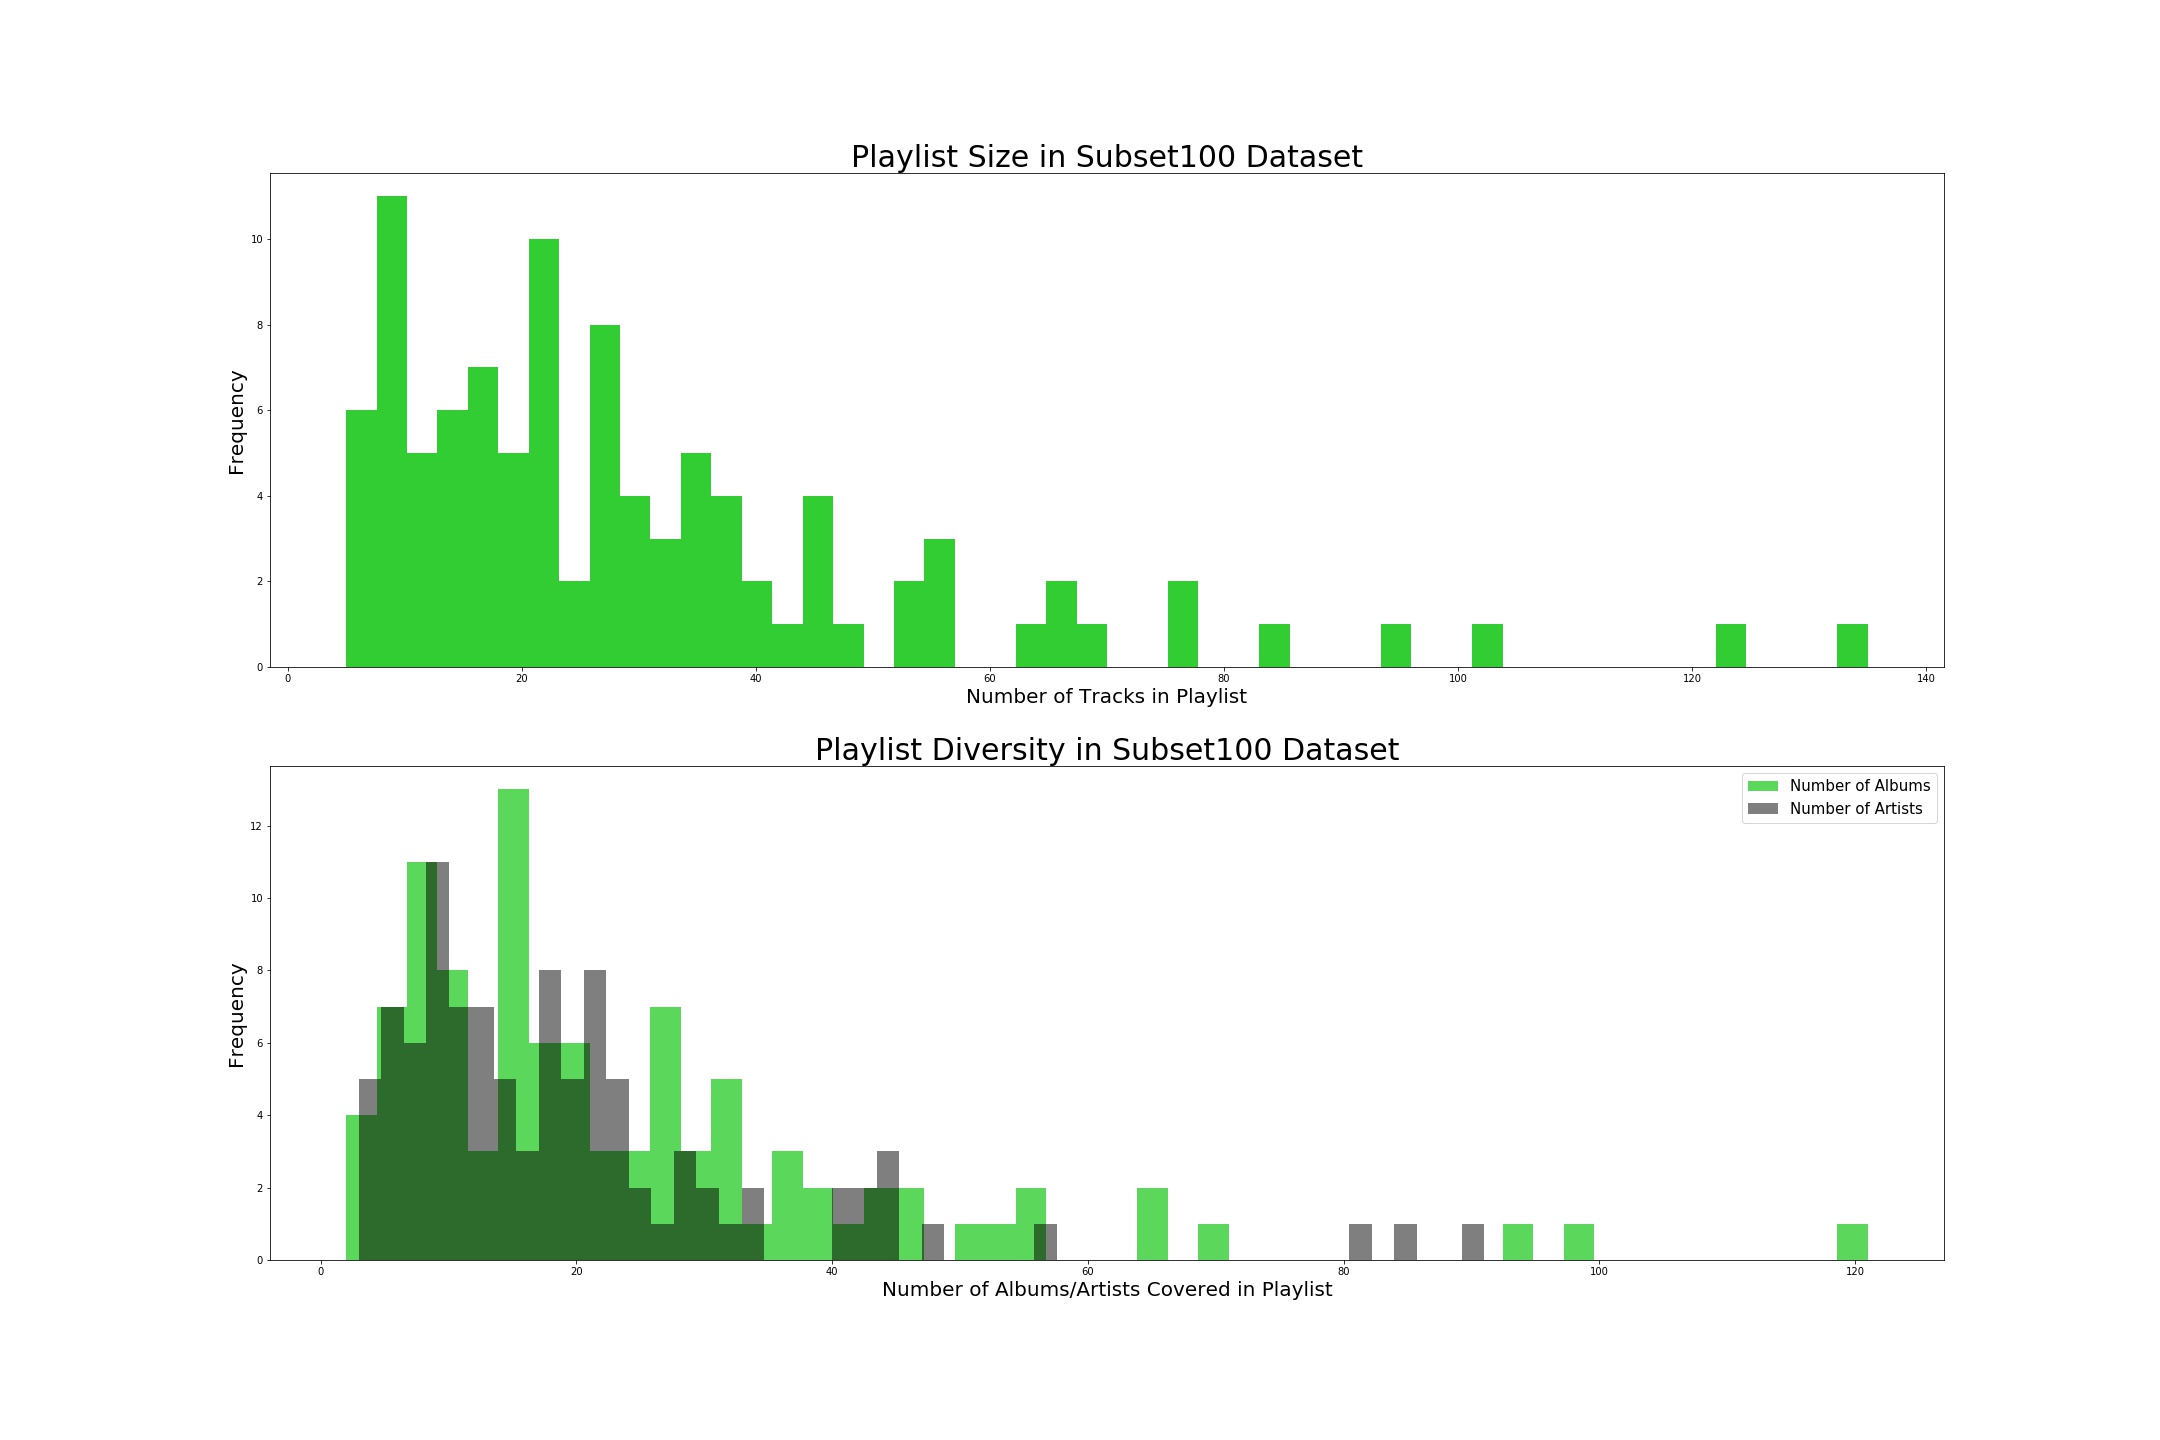
These figures validate that the average playlist size lies around 20 songs, with a little extra redundancy in the numbers of albumns and artists as evidenced by the subtle shift in peak.