ALS Matrix Factorization
Contents
Create Binary Sparse Matrix
import pandas as pd
import numpy as np
from sklearn.model_selection import train_test_split
from sklearn.neighbors import NearestNeighbors
from scipy.sparse import csr_matrix
import tqdm
from tqdm import tqdm
from IPython.display import clear_output
import matplotlib.pyplot as plt
%matplotlib inline
import os

subset100 = pd.read_csv("../raw_data/track_meta_100subset_new.csv")
0. Motivation
ALS, Alternative Least Square, is a method to compute a matrix factorization of user-item matrix. We used ALS to examine the underlying latent factor between playlist and tracks.
0.1 Strategy
We first created a playlist-track relationship table that has each row as one relationship (playlist, track). We then trained our recommendation system on various latent dimensions and number of iterations to run ALS. Finally, we output the scoring of individual tracks for playlist.
To build our prediction set, we recommend the top k tracks with highest latent similarity score. k is pre-determined to be the the test set size * 15.
1. Data Processing
1.1 Train-val-test split
We did a stratified splitting of the data (by Playlistid) into training and test set by 80-20. Stratified splitting ensures that we have the right proportion of train and test for playlists of different lengths.
co_mat = pd.crosstab(train.Playlistid, train.Track_uri)
co_mat = co_mat.clip(upper=1)
1.2 Create a playlist-track relationship data frame
res = []
for i, row in co_mat.iterrows():
    for track in row[row == 1].index.values:
        res.append((i, track))
res = pd.DataFrame(np.array(res), columns=['user', 'items'])
res.head()
| user | items | |
|---|---|---|
| 0 | 430 | spotify:track:0E1NL6gkv5aQKGNjJfBE3A |
| 1 | 430 | spotify:track:0OuPMjmicFfmnB3SFFqdgQ |
| 2 | 430 | spotify:track:0TIv1rjOG6Wbc02T4p3y7o |
| 3 | 430 | spotify:track:1CtOCnWYfIwVgIKiR2Lufw |
| 4 | 430 | spotify:track:1lNGwNQX4IrvDwgETwyPjR |
2. Model Training
2.1 ALS model class
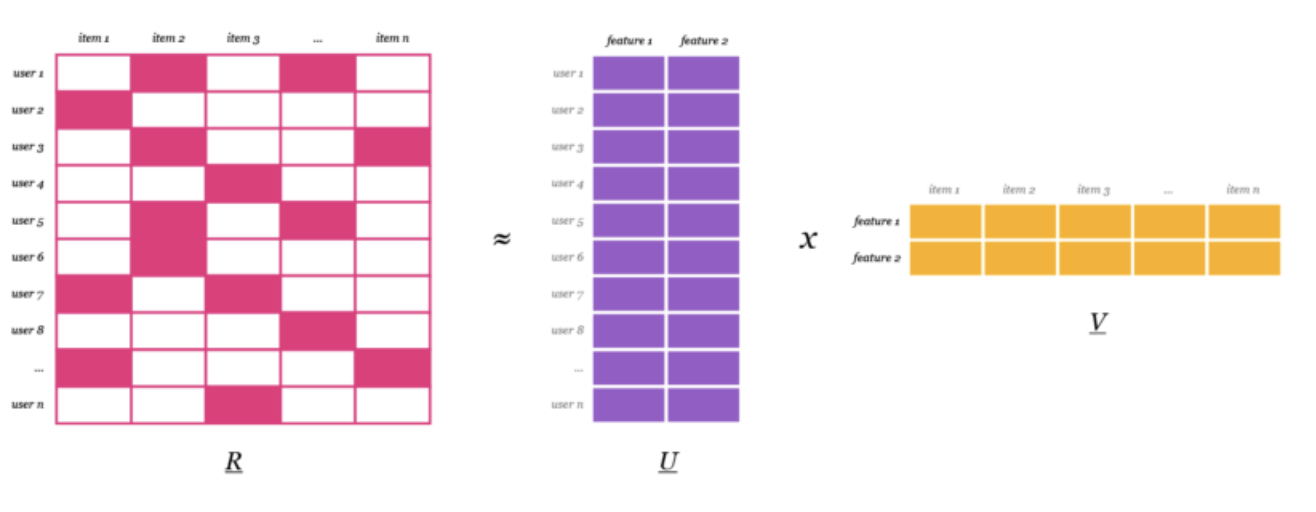
ALS is an iterative optimization process where we for every iteration try to arrive closer and closer to a factorized representation of our original data.
We have our original matrix R of size u x i with our playlist, tracks. We then want to find a way to turn that into one matrix with users and hidden features of size u x f and one with items and hidden features of size f x i. In U and V we have weights for how each user/item relates to each feature. What we do is we calculate U and V so that their product approximates R as closely as possible: R ≈ U x V.

Picture source: https://medium.com/radon-dev/als-implicit-collaborative-filtering-5ed653ba39fe
2.2 Model Training
rs = ALSRecommenderSystem(res, True, latent_dimension=20)
rs.train(0.0001, iterations=30)
2.3 Metrics
We used the following metrics to evaluate our model, based on Spotify RecSys rules
- R-precision: the number of retrieved relevant tracks divided by the number of known relevant tracks (i.e., the number of withheld tracks). This metric rewards total number of retrieved relevant tracks (regardless of order).

- NDCG: Discounted cumulative gain (DCG) measures the ranking quality of the recommended tracks, increasing when relevant tracks are placed higher in the list. Normalized DCG (NDCG) is determined by calculating the DCG and dividing it by the ideal DCG in which the recommended tracks are perfectly ranked.

2.4 Model Performance
| Data | R-Precision | NDCG | Average of the two metrics |
|---|---|---|---|
| Test set of 100 playlists | 0.239692 | 0.150403 | 0.195048 |
3. Conclusion
We achieved a 0.239 R-precision score and 0.1504 NDCG score with our Alternating Least Squares model. Interestingly, it greatly improves R-precision, it has similar NDCG score with other model approaches we tried, e.g., k-means clustering.
NDCG score does not perform as good as I expected, because ALC considers similarity and it suggests songs with higher similarity. One of the reasons I suspect is because some of the items have very high similarity scores (e.g., score > 0.999) and therefore, the ranking of the suggestion might be less sensitive.